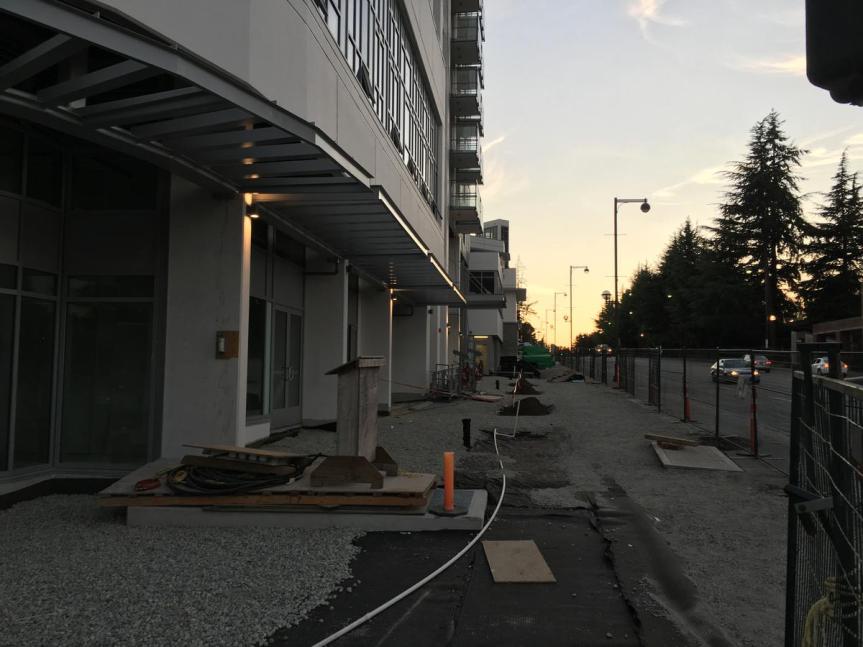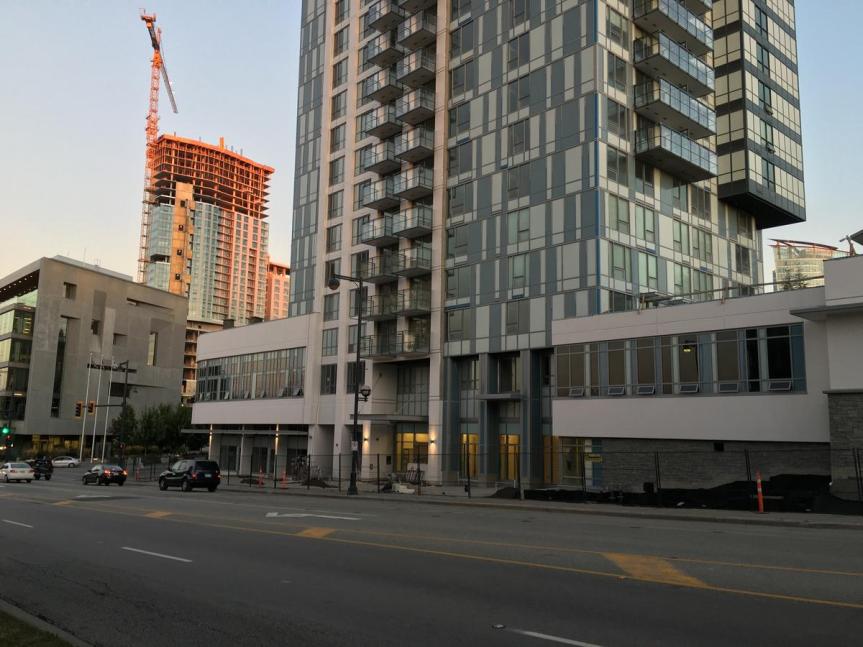

Surrey City Centre on February 7, 2017
Census data released today by Statistics Canada has revealed that Surrey’s population has surpassed 500,000. As of May 2016 last year, the population of Surrey was 517,887, an increase from 468,251 in 2011 representing a growth rate of 10.6%, outpacing the national average, British Columbia, the City of Vancouver, and the Vancouver CMA.
In comparison, between 2011 and 2016:
- Canada as a whole grew by 5.0%
- British Columbia grew by 5.6%
- City of Vancouver grew by 4.6%
- Vancouver Census Metropolitan Area (CMA): 6.5%
The only Vancouver CMA municipality to grow faster than Surrey was the Township of Langley which grew at a rapid 12.6%. As a whole, the Vancouver CMA grew to 2,463,431.
With Surrey adding an average of 1,000 new residents per month, as of February 2017, the population of Surrey can be estimated to have already increased further to 525,000. It is expected that Surrey will surpass Vancouver in population to become the largest city in BC by 2030.
Looking at growth by Census Tract, the areas of Surrey growing the fastest were in the south and east, in places such as Grandview Heights, Sunnyside Heights, South Newton, and Clayton. There was also noticeably strong growth in Surrey City Centre as a result of new condo developments in recent years, with one Census Tract east of King George Blvd and south of 104th Avenue growing by 33%. This growth in City Centre will likely increase even more by the 2021 Census, with more new condo developments expected to be completed within City Centre in the next 5 years than in the previous 5 years.
Developable land and affordability in comparison to Vancouver can both be seen as driving factors in Surrey’s strong growth.

Growth rate by Census Tract in Metro Vancouver

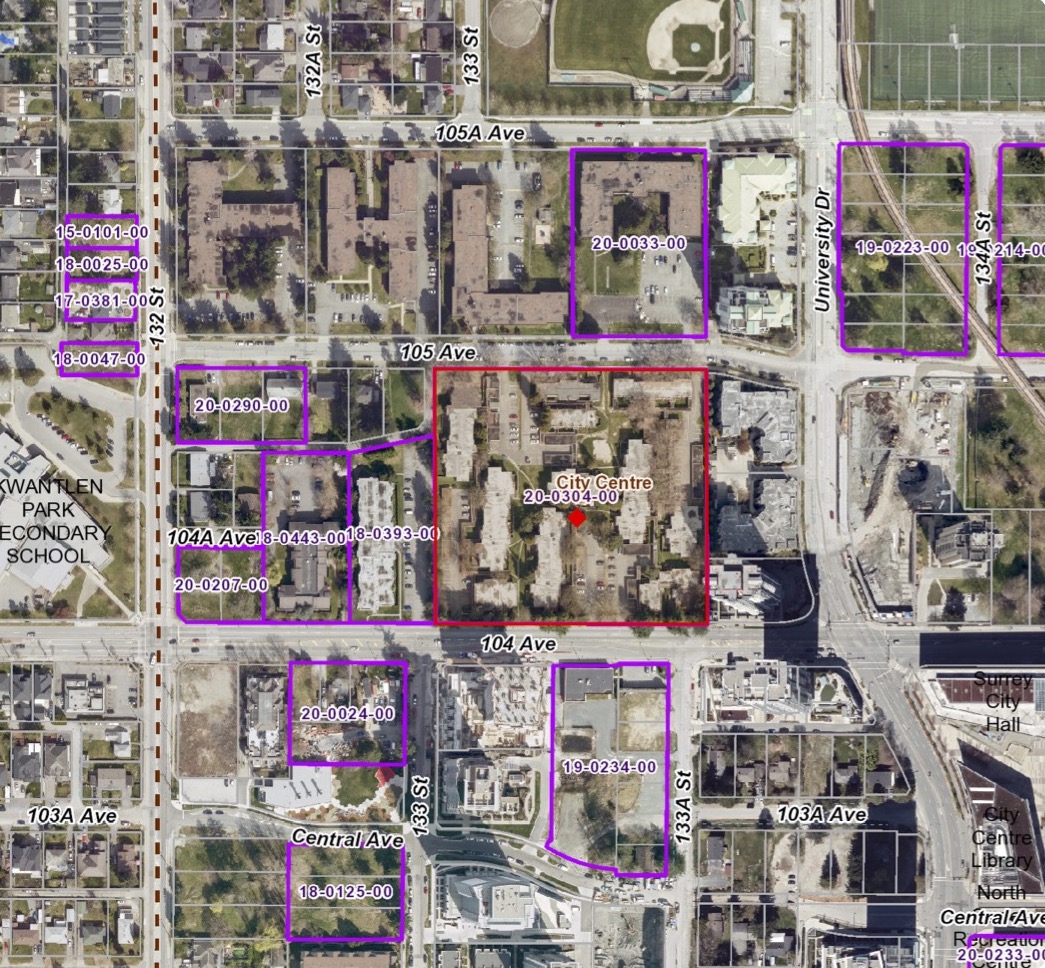
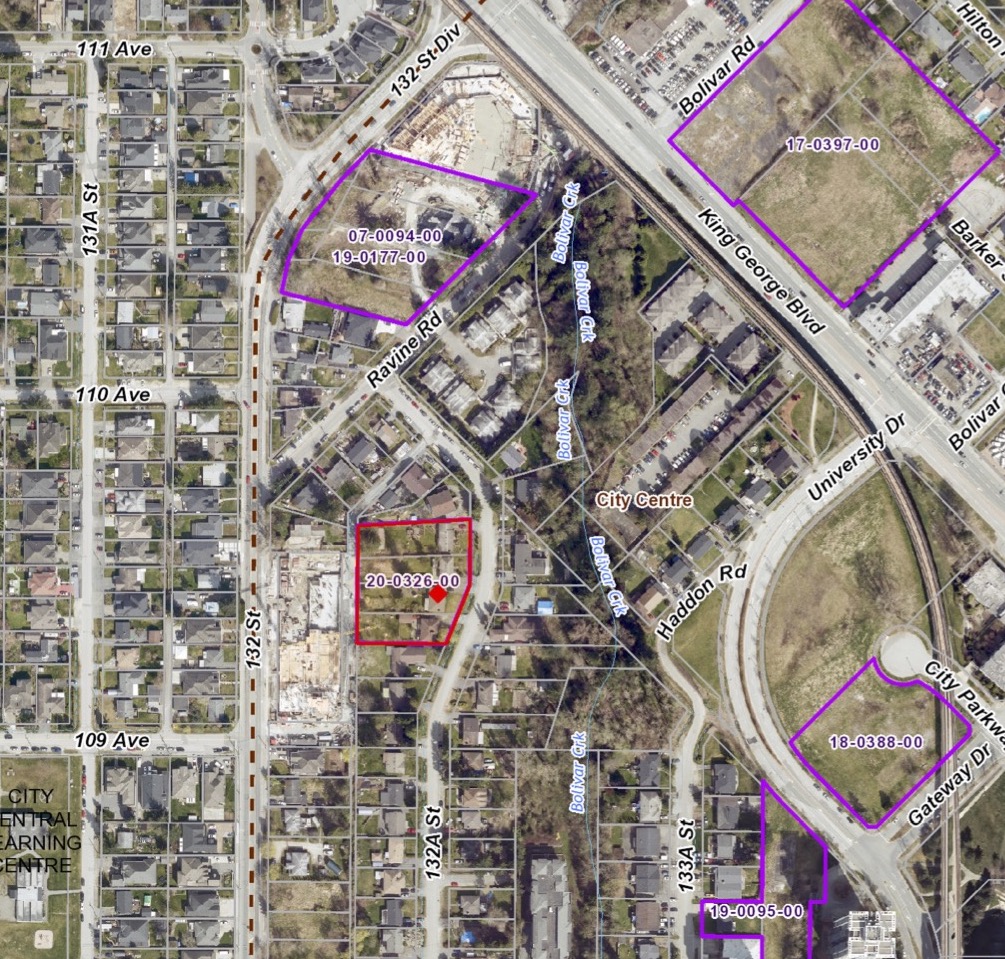
Growth rate by Census Tract in North Surrey – Area east of King George Blvd and south of 104th Ave grew by 33%.
https://censusmapper.ca/maps/583#11/49.2613/-123.1145
Looking at growth in absolute numbers. Surrey outpaced every municipality within Metro Vancouver by a large margin, adding a total of 49,636 residents between 2011 and 2016. Vancouver came in second adding 27,984 new residents.
Population Growth of Metro Vancouver cities 2011-2016
| 2016 | 2011 | Total Growth | |
| Metropolitan Vancouver | 2,463,431 | 2,313,328 | 150,103 |
| Surrey | 517,887 | 468,251 | 49,636 |
| City of Vancouver | 631,486 | 603,502 | 27,984 |
| Langley | 117,285 | 104,177 | 13,108 |
| Coquitlam | 139,284 | 126,804 | 12,480 |
| Burnaby | 232,755 | 223,218 | 9,537 |
| Richmond | 198,309 | 190,473 | 7,836 |
| Maple Ridge | 82,256 | 76,052 | 6,204 |
| New Westminster | 70,996 | 65,976 | 5,020 |
| North Vancouver | 52,898 | 48,196 | 4,702 |
| Port Coquitlam | 58,612 | 55,958 | 2,654 |
| Delta | 102,238 | 99,863 | 2,375 |
| North Vancouver | 85,935 | 84,412 | 1,523 |
| Pitt Meadows | 18,573 | 17,736 | 837 |
| Langley | 25,888 | 25,081 | 807 |
| White Rock | 19,952 | 19,339 | 613 |
| Port Moody | 33,551 | 33,011 | 540 |
| West Vancouver | 42,473 | 42,694 | -221 |
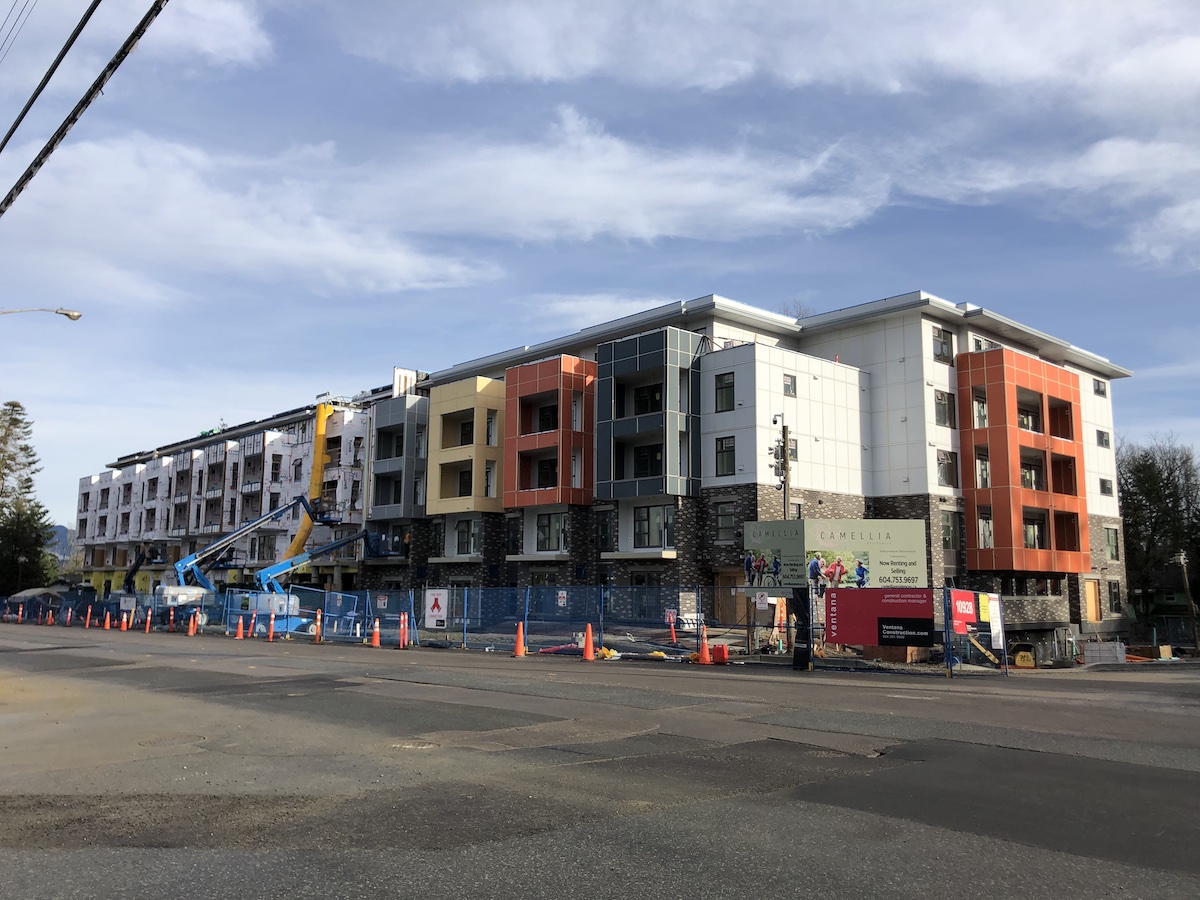 Camellia | 5-Storey Seniors Residential | 132 St & 109 Ave
 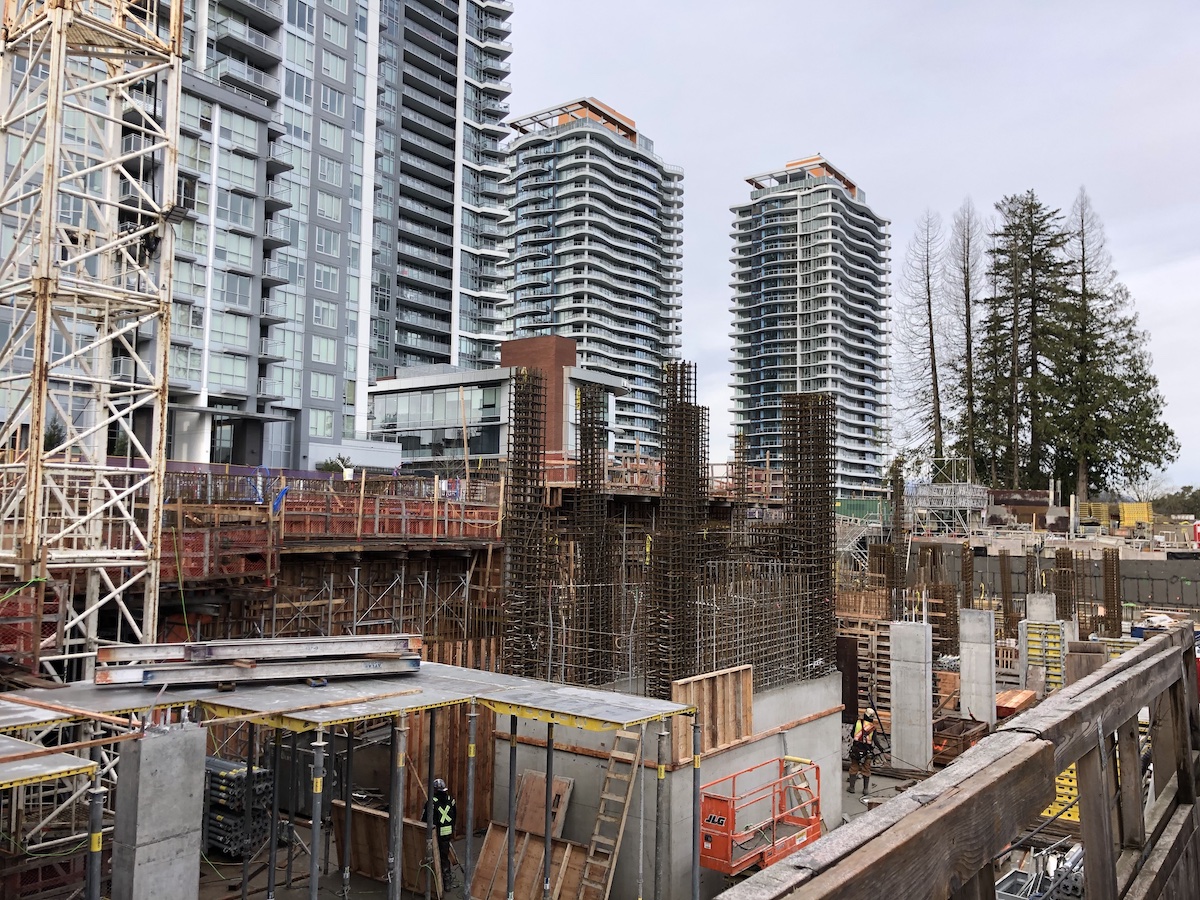 One Central | 44-Storey Residential + Retail | 133 St & Central Ave
 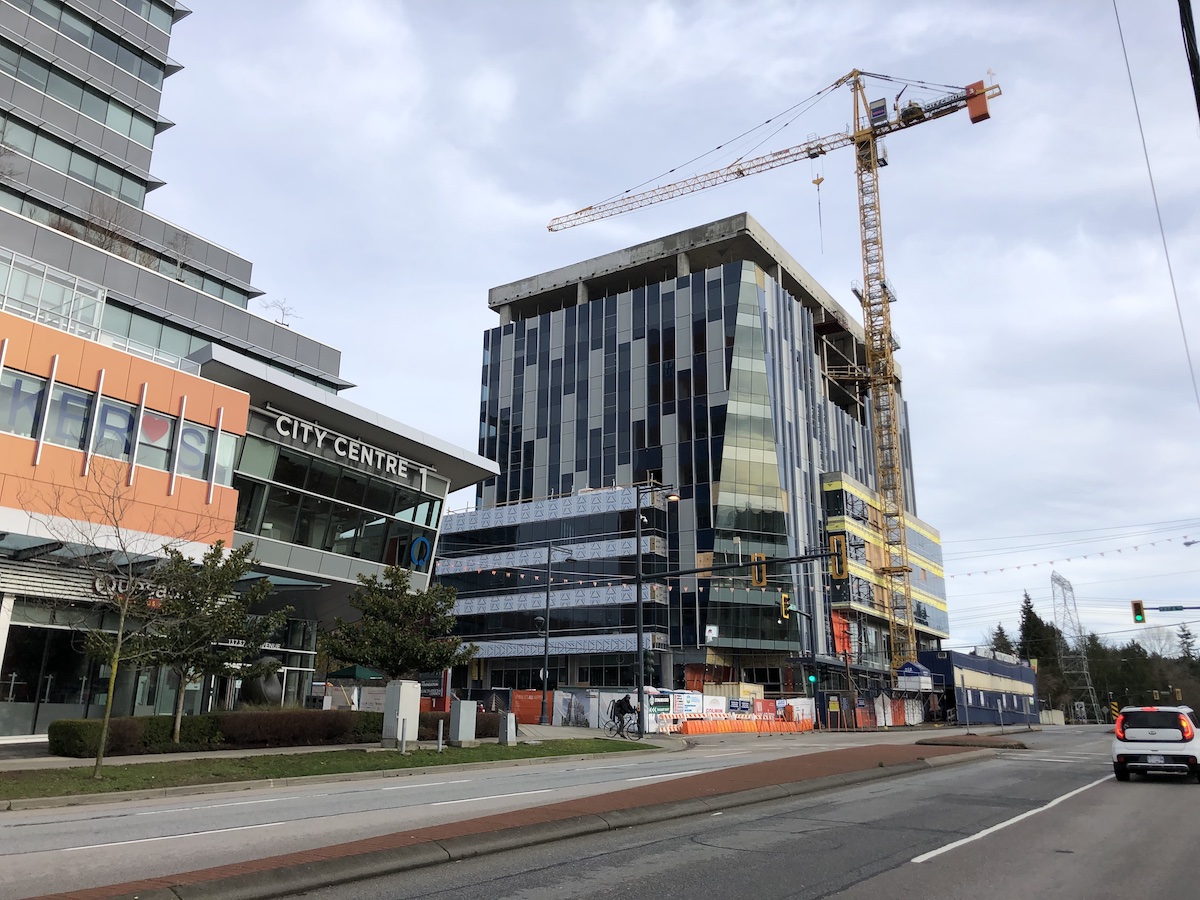 City Centre 3 | 10-Storey Office + Retail | 96 Ave & 137A St
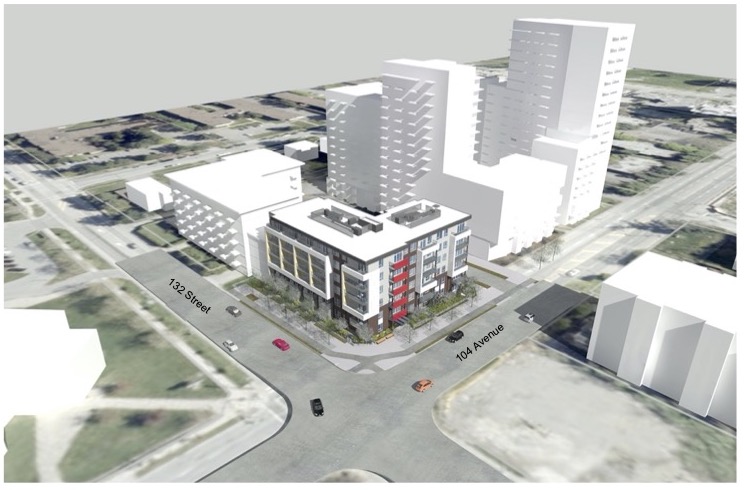
 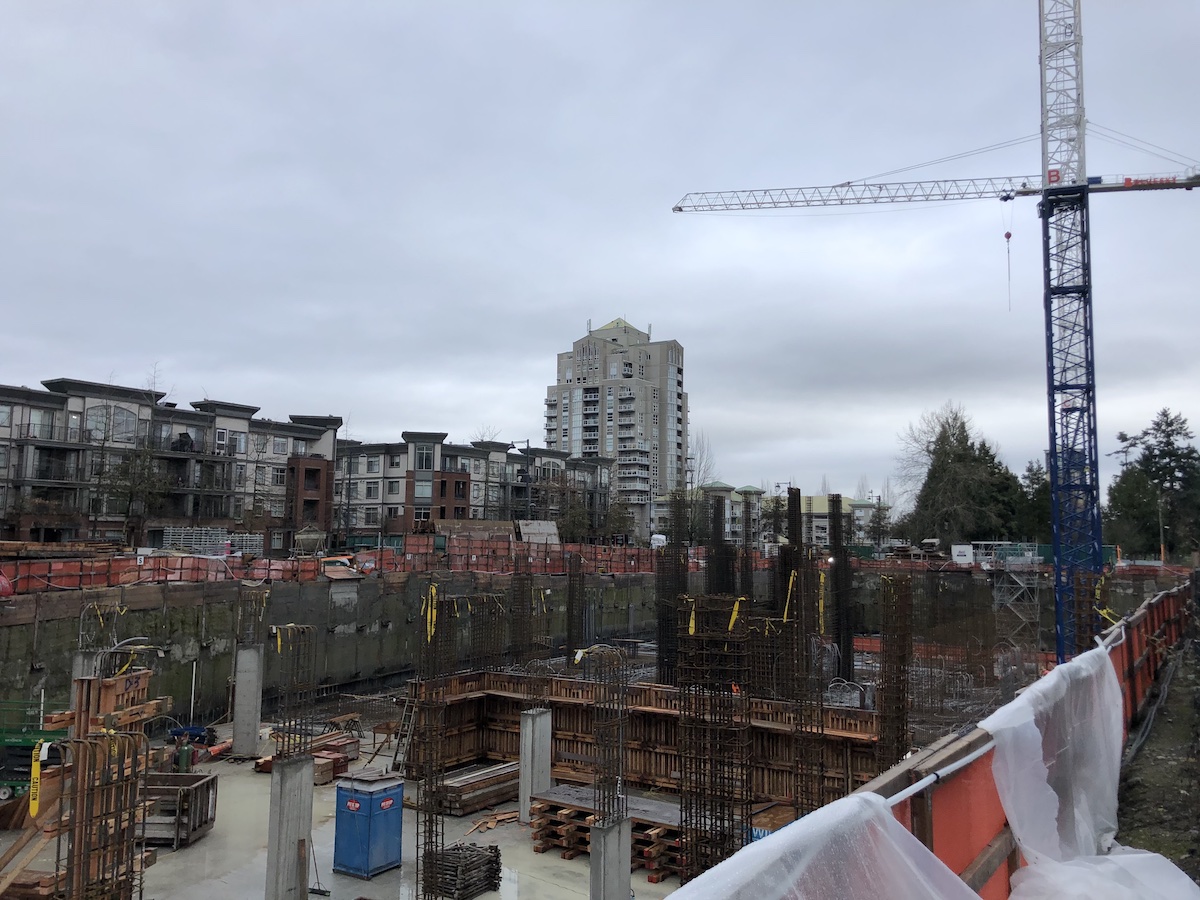 University District | 28 & 37-Storey Residential + Retail | University Dr & 104 Ave
 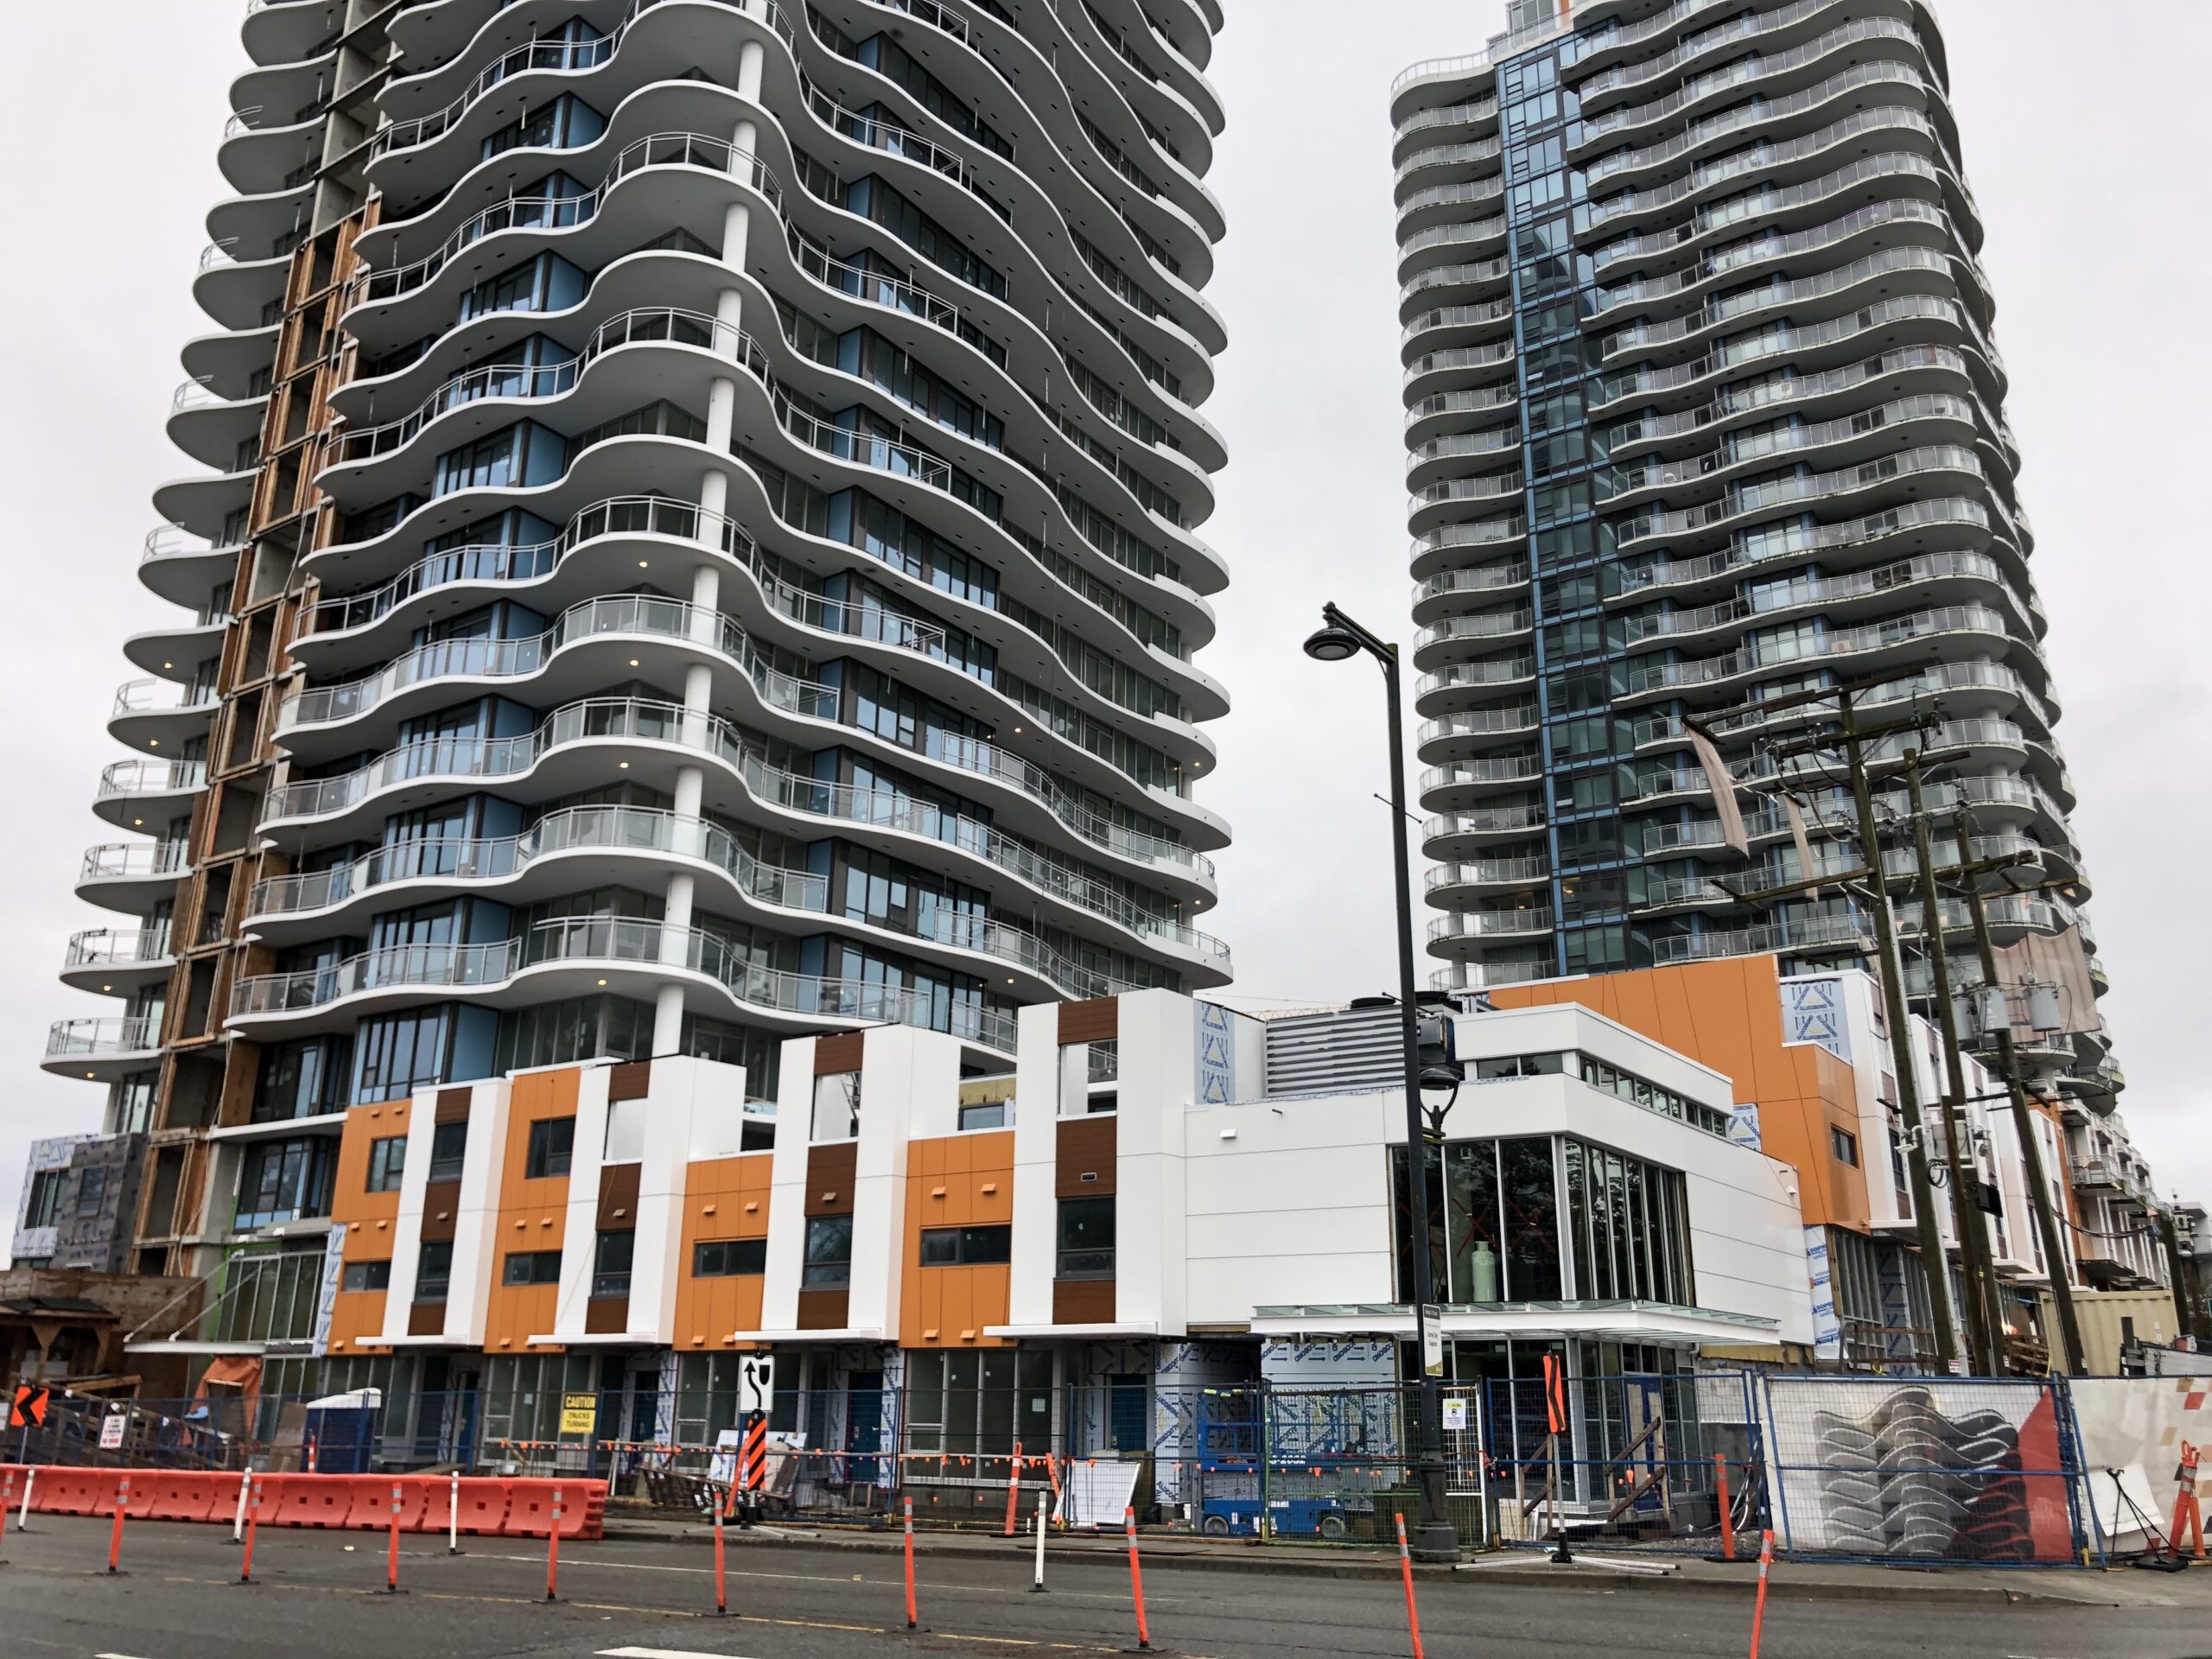 Linea | 28-Storey Residential | 133A St & 104 Ave
 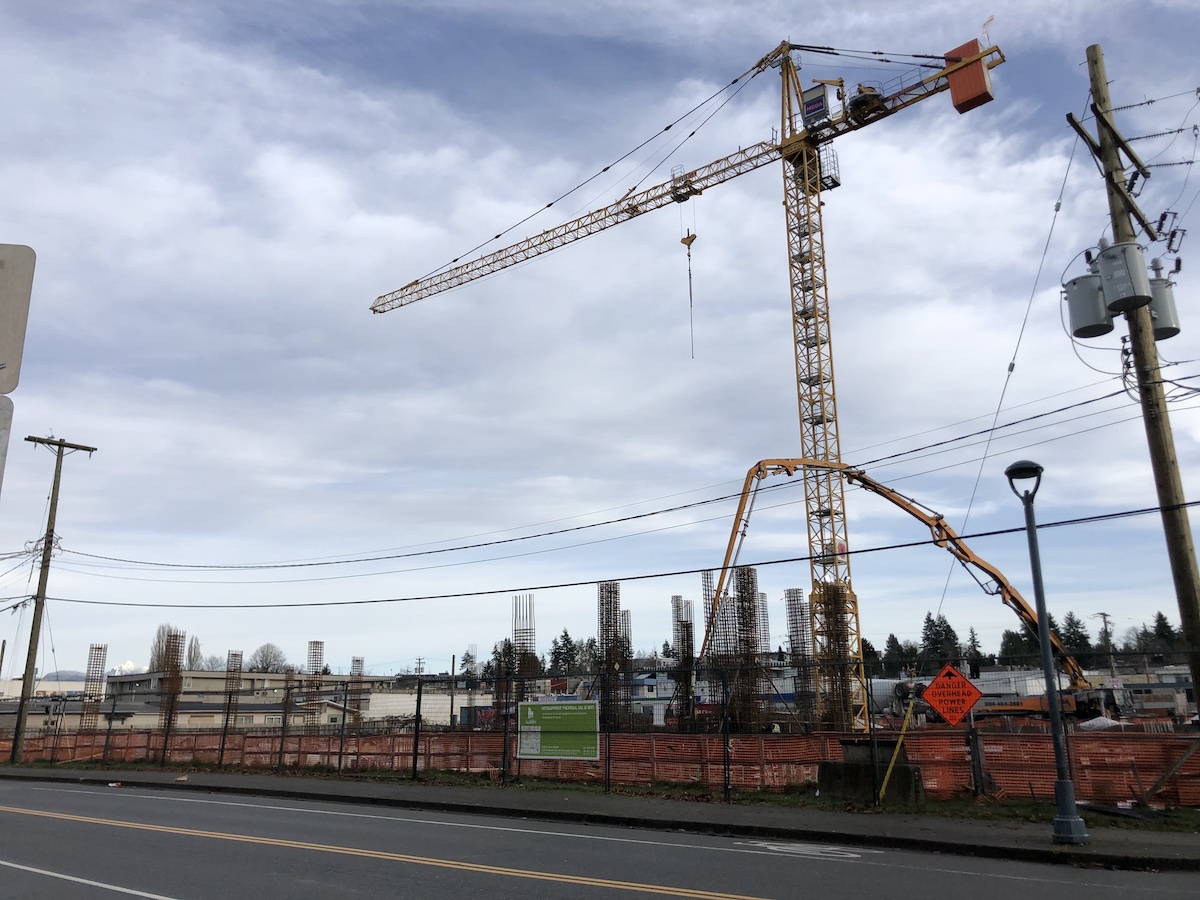 Legion Veterans Village | 20-Storey Mixed-Use | City Parkway & 106 Ave
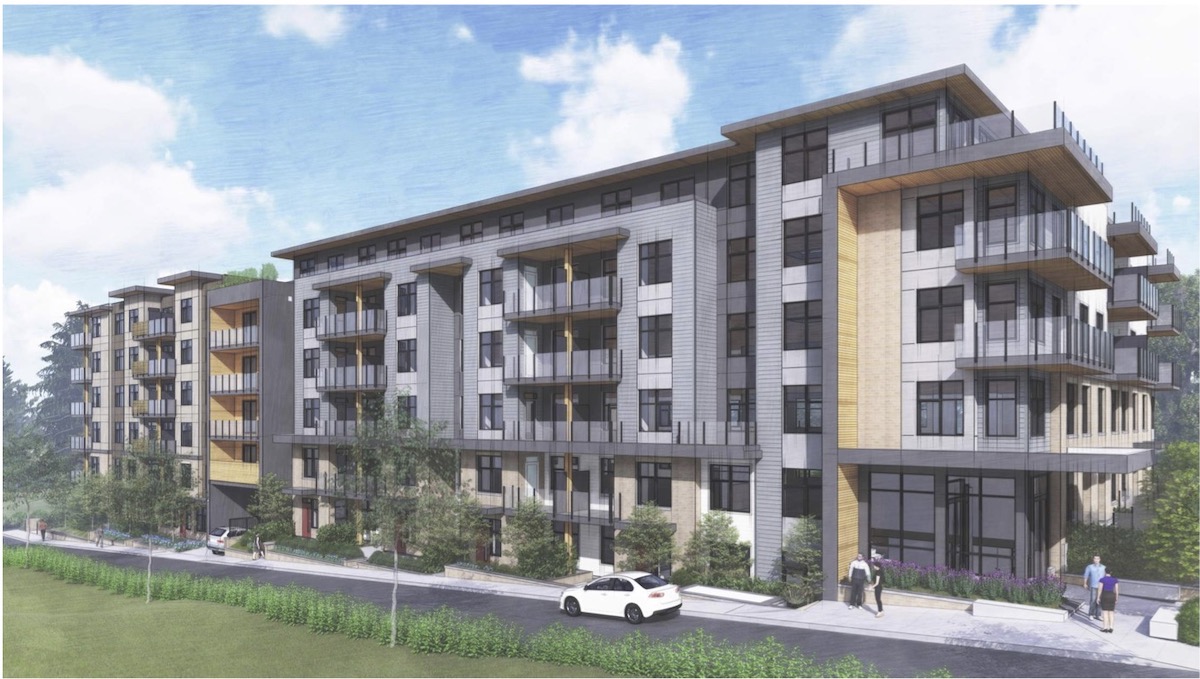
 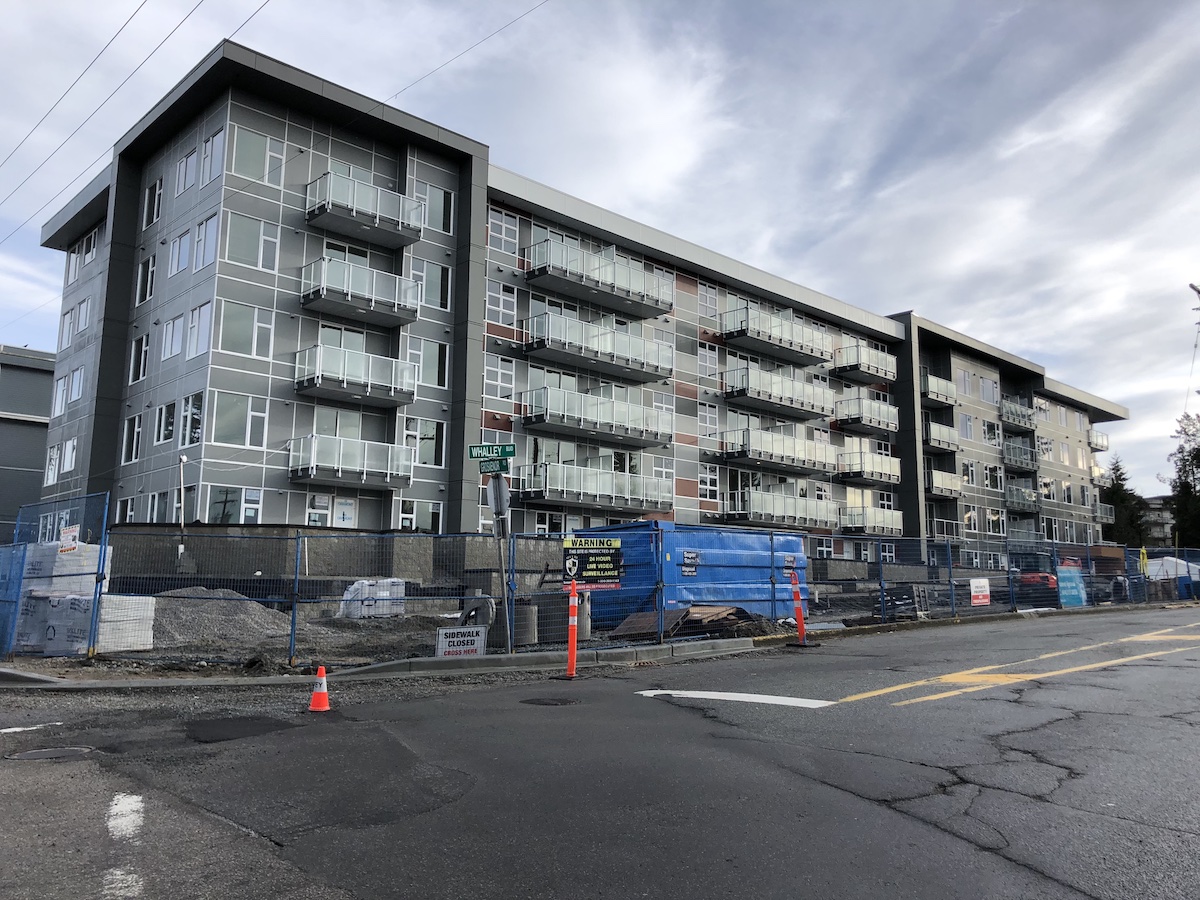 Maverick | 5-Storey Residential | Whalley Blvd & Grosvenor Rd
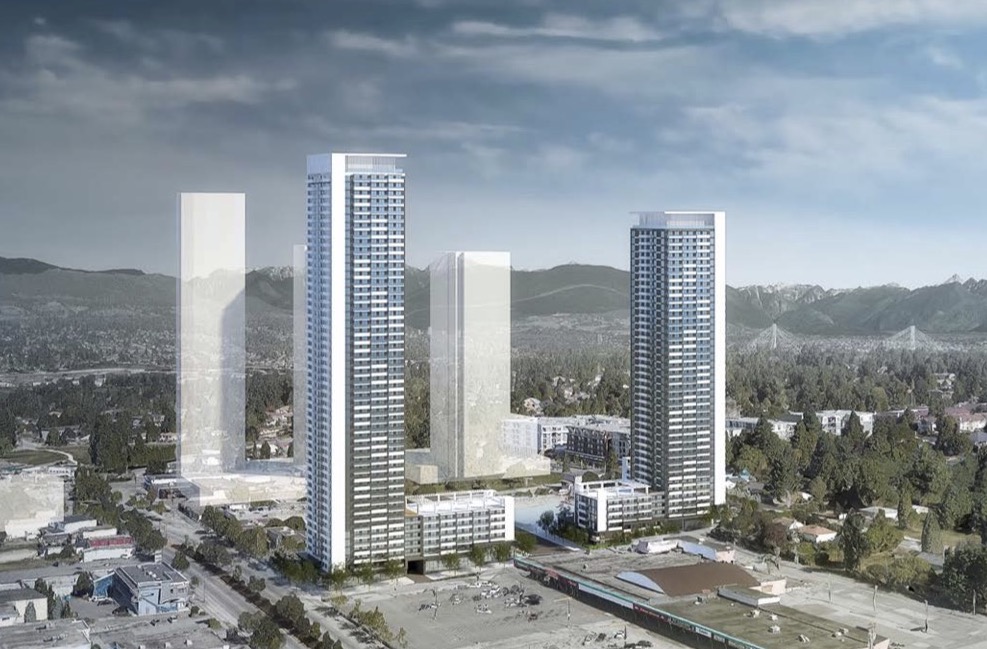
 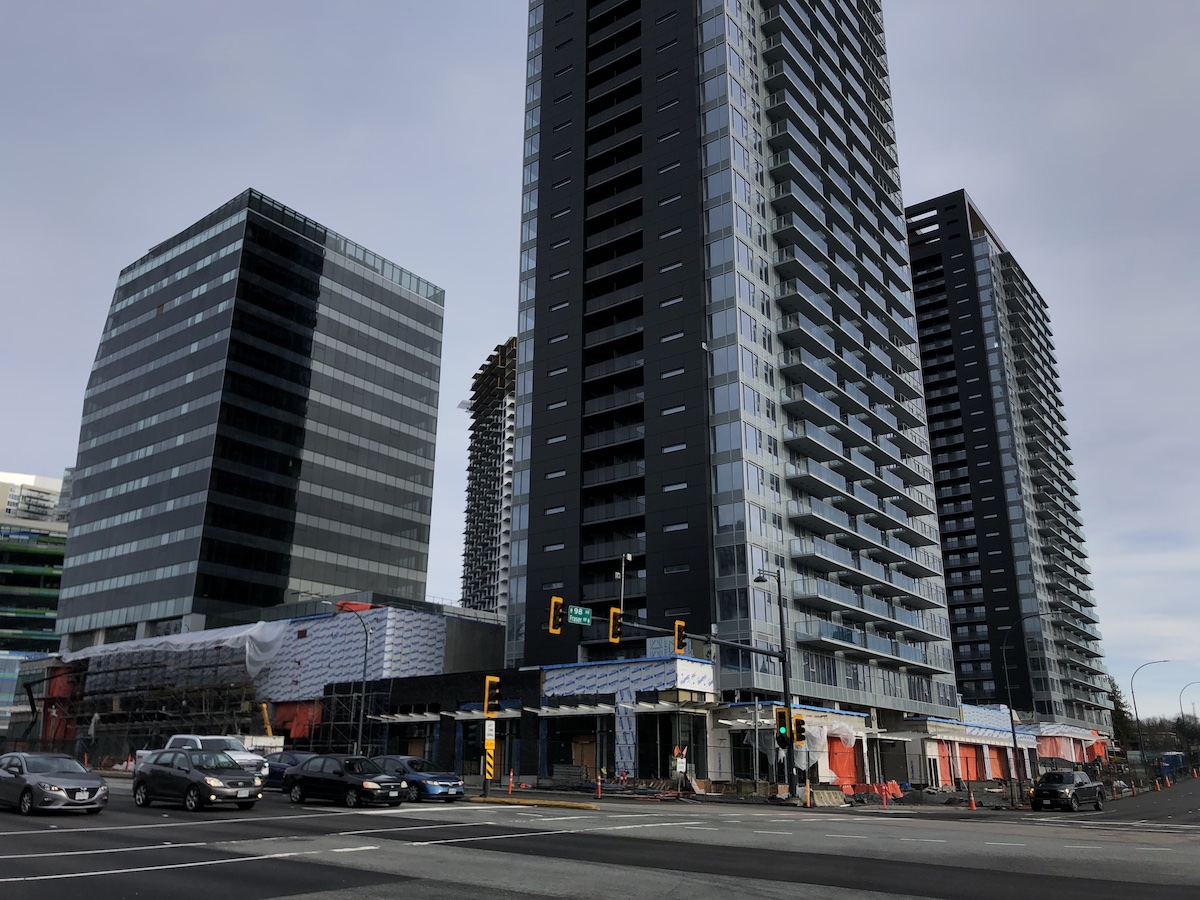 King George Hub (Phase B + C) | 29, 34 & 40-Storey Residential + 15-Storey Office + Retail | King George Blvd & Fraser Hwy
 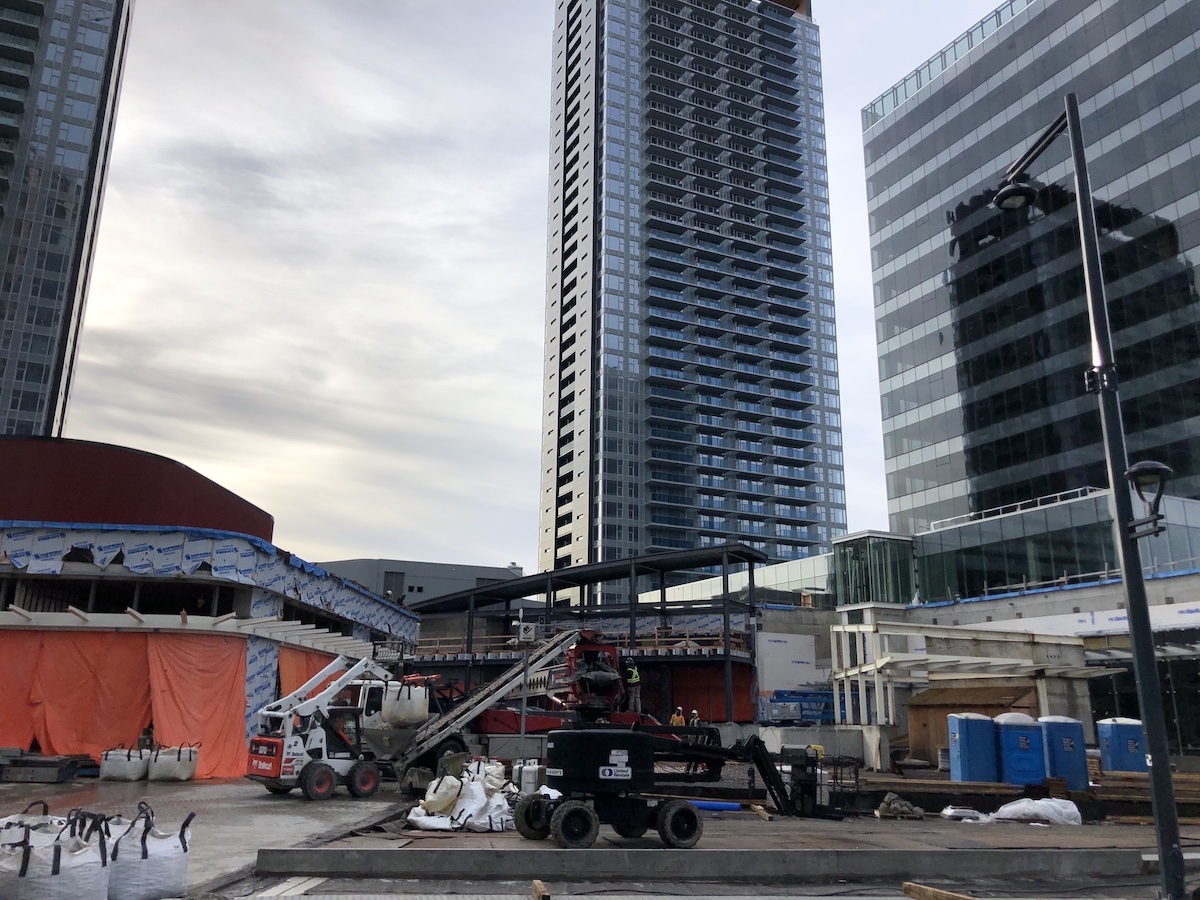 King George Hub (Phase B) Retail Component | King George Blvd & Fraser Hwy
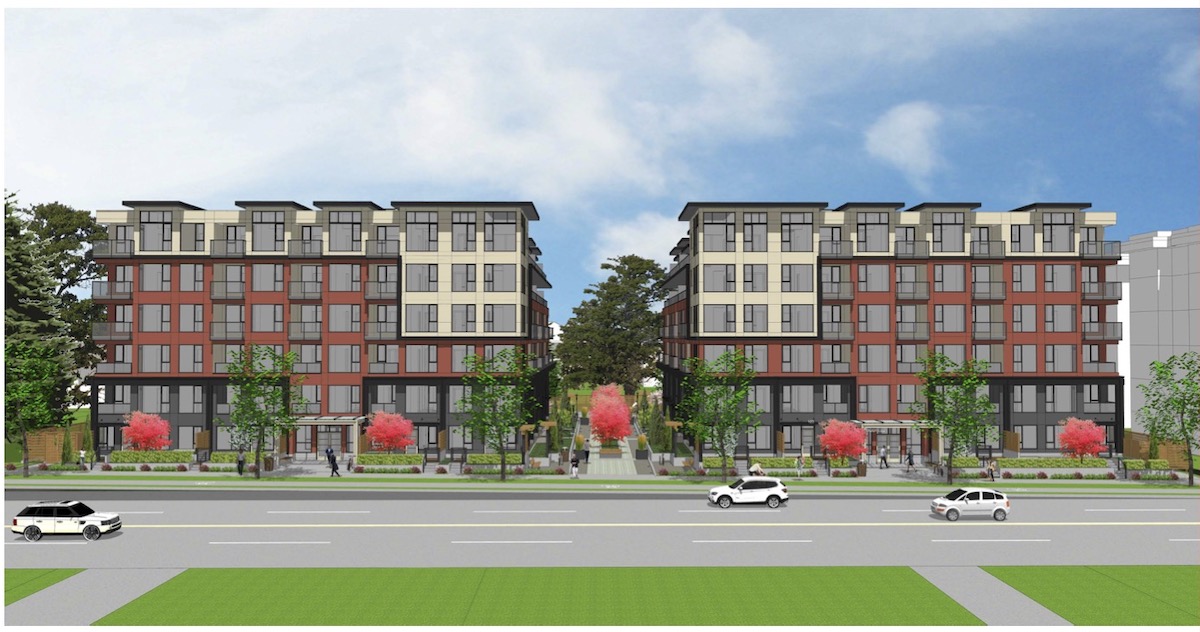
 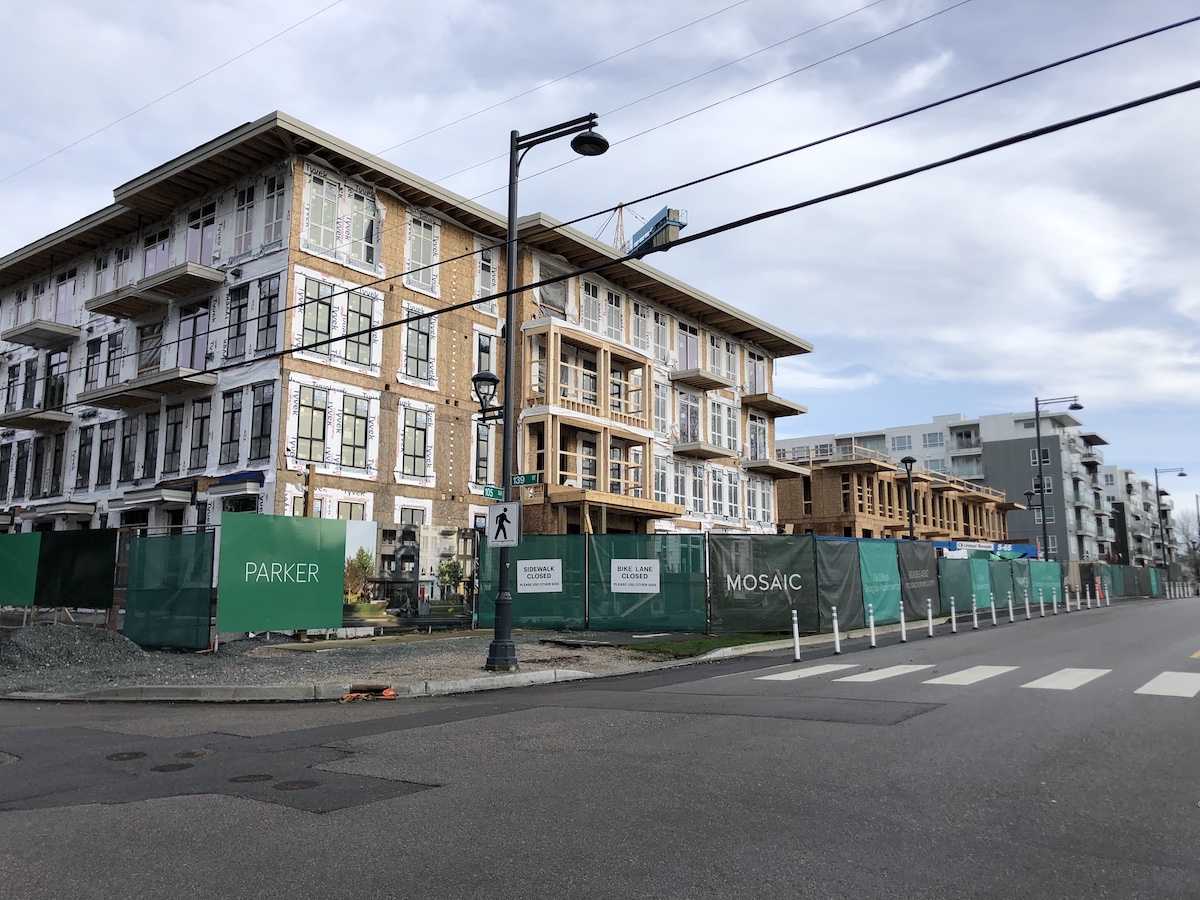 Parker | 4-Storey Residential | 139 St & 105 Ave
 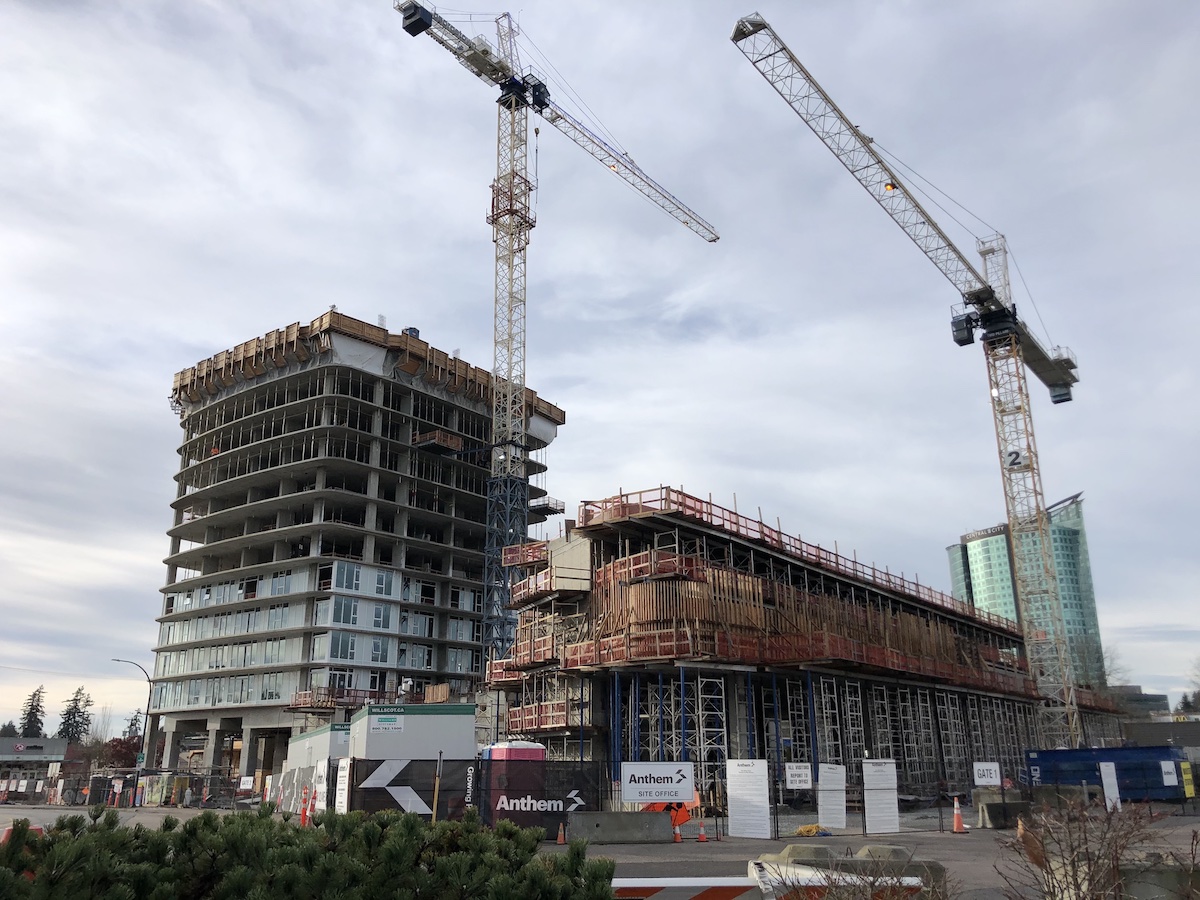 Georgetown One | 30-Storey Residential + Retail | 102 Ave & Whalley Blvd